在Archlinux配置Prometheus和Grafana Dashboard
在 Arch 上配置 Prometheus + Grafana 的实践指南,包含 exporter 安装、Docker/cAdvisor 示例、dashboards 与告警配置要点。
之前使用Netdata监控服务器各项数据,但是完整版需要收费,在免费试用到期后换成 Grafana + Prometheus 做数据采集和可视化,下文介绍在Archlinux下配置教程
文件配置#
我配置了除系统信息配置外还有 Postgresql 、Systemd 、Docker 的图表,需要安装不同的 exporter 实现。先安装主要的程序:`
pacman -S prometheus grafana prometheus-node-exporter alertmanager上面的软件包含了数据源、图表展示,但是支持的数据只有基本的如CPU、内存、磁盘能的数据,我自己还安装了额外的 exporter ,可以使用 yay Prometheus 命令查看支持的,我自己安装的有 prometheus-postgres-exporter 和 prometheus-systemd-exporter。
各个软件需要修改的配置文件:
Prometheus(/etc/prometheus/prometheus.yml):
# my global config
global:
  scrape_interval: 15s # Set the scrape interval to every 15 seconds. Default is every 1 minute.
  evaluation_interval: 15s # Evaluate rules every 15 seconds. The default is every 1 minute.
  # scrape_timeout is set to the global default (10s).

# Alertmanager configuration
alerting:
  alertmanagers:
    - static_configs:
      - targets:
        - localhost:9093

# Load rules once and periodically evaluate them according to the global 'evaluation_interval'.
rule_files:
  # - "alert.rules.yml"
  # - "first_rules.yml"
  # - "second_rules.yml"

# A scrape configuration containing exactly one endpoint to scrape:
# Here it's Prometheus itself.
scrape_configs:
  # The job name is added as a label `job=<job_name>` to any timeseries scraped from this config.
  - job_name: "prometheus"
    # metrics_path defaults to '/metrics'
    # scheme defaults to 'http'.
    static_configs:
      - targets: ["localhost:9090"]
  - job_name: 'node'
    static_configs:
      - targets: ['localhost:9100']
  - job_name: 'cadvisor'  #获取Docker状态
    static_configs:
      - targets: ['localhost:9200']
  - job_name: 'postgres'  #获取postgresql数据
    static_configs:
      - targets: ['localhost:9187']
  - job_name: 'systemd'  #获取Systemd服务状态
    static_configs:
      - targets: ['localhost:9558']
修改完可以启动 prometheus.service,启动后访问 http://127.0.0.1:9090 会有一个简陋的图表界面。
alertmanager(/etc/alertmanager/alertmanager.yml):
global:
  resolve_timeout: 5m
  smtp_smarthost: 'smtp.xxx.com:25'
  smtp_from: '[email protected]'
  smtp_auth_username: '[email protected]'
  smtp_auth_password: 'password'
route:
  group_by: ['instance', 'severity']
  group_wait: 30s
  group_interval: 5m
  repeat_interval: 1h
  receiver: rece-1
receivers:
  - name: 'rece-1'
    email_configs:
      - to: '[email protected]'

  - name: 'web.hook'
    webhook_configs:
      - url: 'http://127.0.0.1:5001/'
inhibit_rules:
  - source_match:
      severity: 'critical'
    target_match:
      severity: 'warning'
equal: ['alertname', 'dev', 'instance']启动 alertmanager.service服务。
prometheus-node-exporter不需要修改文件可以直接启动服务。- 如果要使用
prometheus-node-exporter有一些特性没有使用,需要自己加参数开启,参考(https://github.com/prometheus/node_exporter),我的配置文件(`/etc/conf.d/prometheus-postgres-exporter`): ↗
DATA_SOURCE_URI=":5432?host=/var/run/postgresql&sslmode=disable"
DATA_SOURCE_USER="postgres"
POSTGRES_EXPORTER_ARGS="--collector.postmaster"同时因为我需要监控 docker容器,用到了 cAdvisor,但是 aur的包过期了,所以使用了 docker-compose.yml部署:
services:
    cadvisor:
        image: gcr.io/cadvisor/cadvisor
        container_name: cadvisor
        restart: always
        volumes:
            - /:/rootfs:ro
            - /var/run:/var/run:rw
            - /sys:/sys:ro
            - /var/lib/docker/:/var/lib/docker:ro
            - /dev/disk/:/dev/disk:ro
        devices:
          # 挂载设备
          - /dev/kmsg
        ports:
            - "9200:8080"
使用 docker-compose -f ./docker-compose.yml up -d 启动容器。
图表展示#
上节是数据采集方面的配置,现在需要启动图表展示 grafana服务,默认使用3000端口,如果端口被占用可以修改配置文件(/etc/grafana.ini)里的 http_port = 3300,修改为你需要的端口,然后启动服务。
打开网址使用账号密码都是admin/admin登录,第一次登录会让你修改密码。设置完密码需要添加数据源


设置完保存即可,然后就可以设置展示图表了。

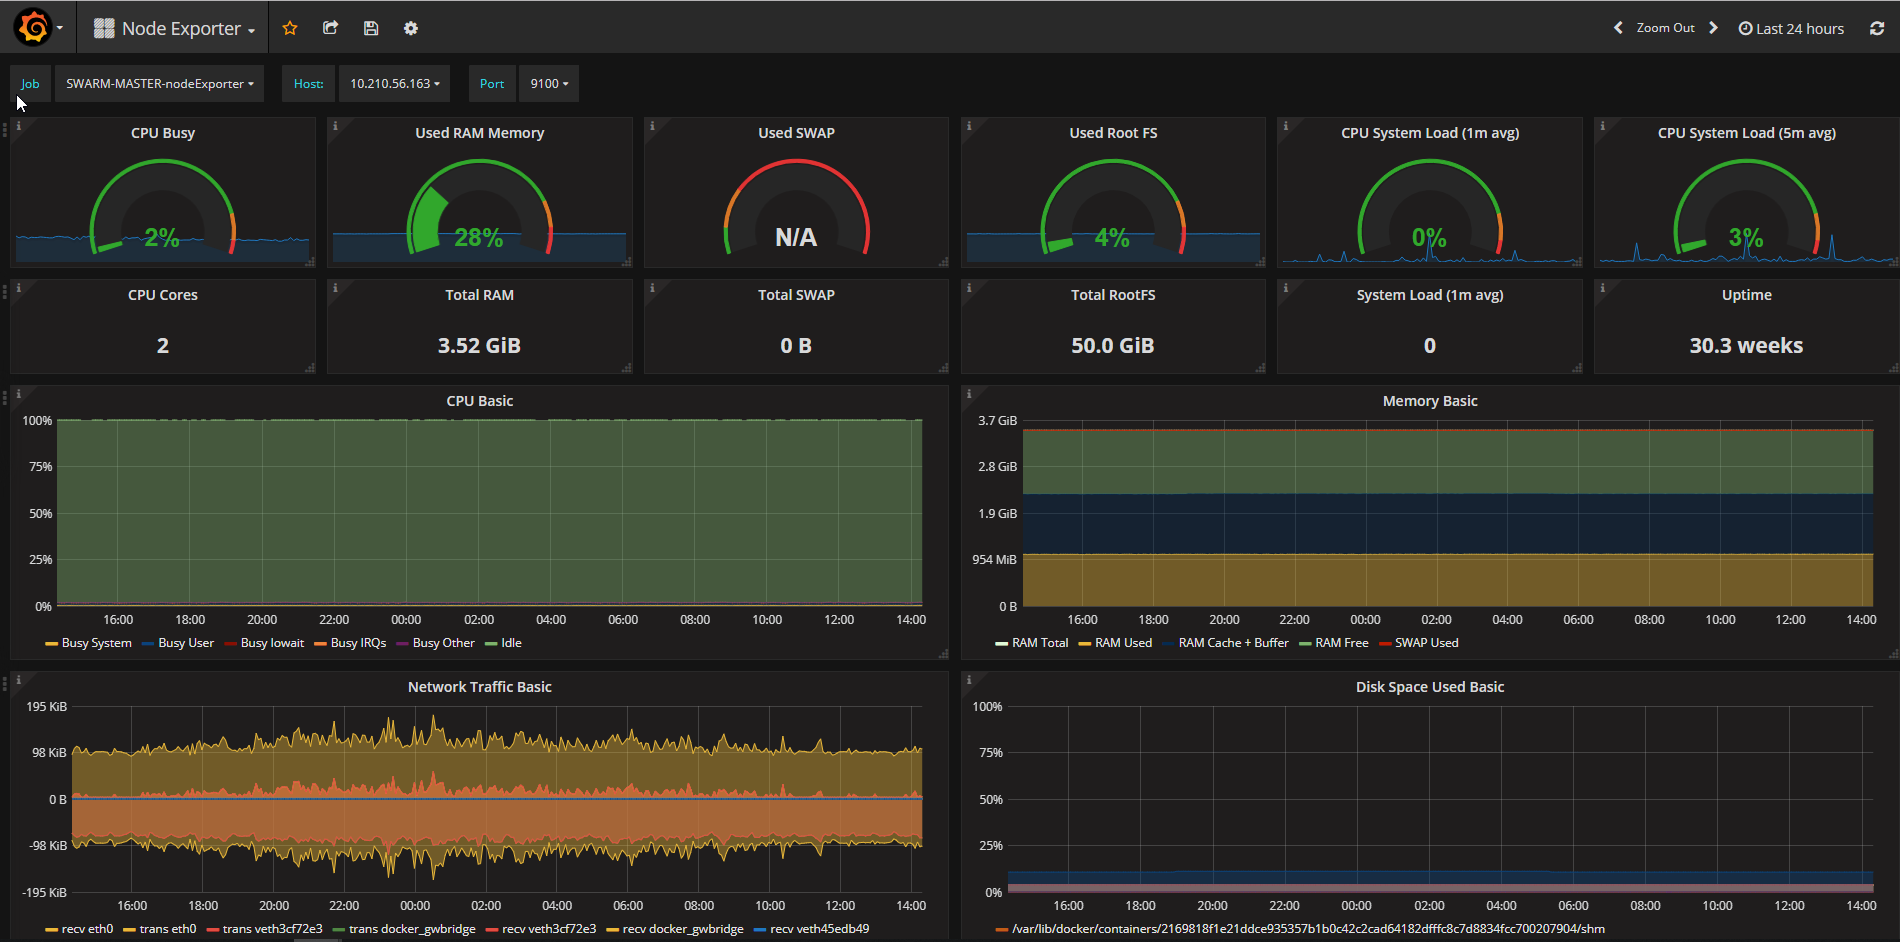
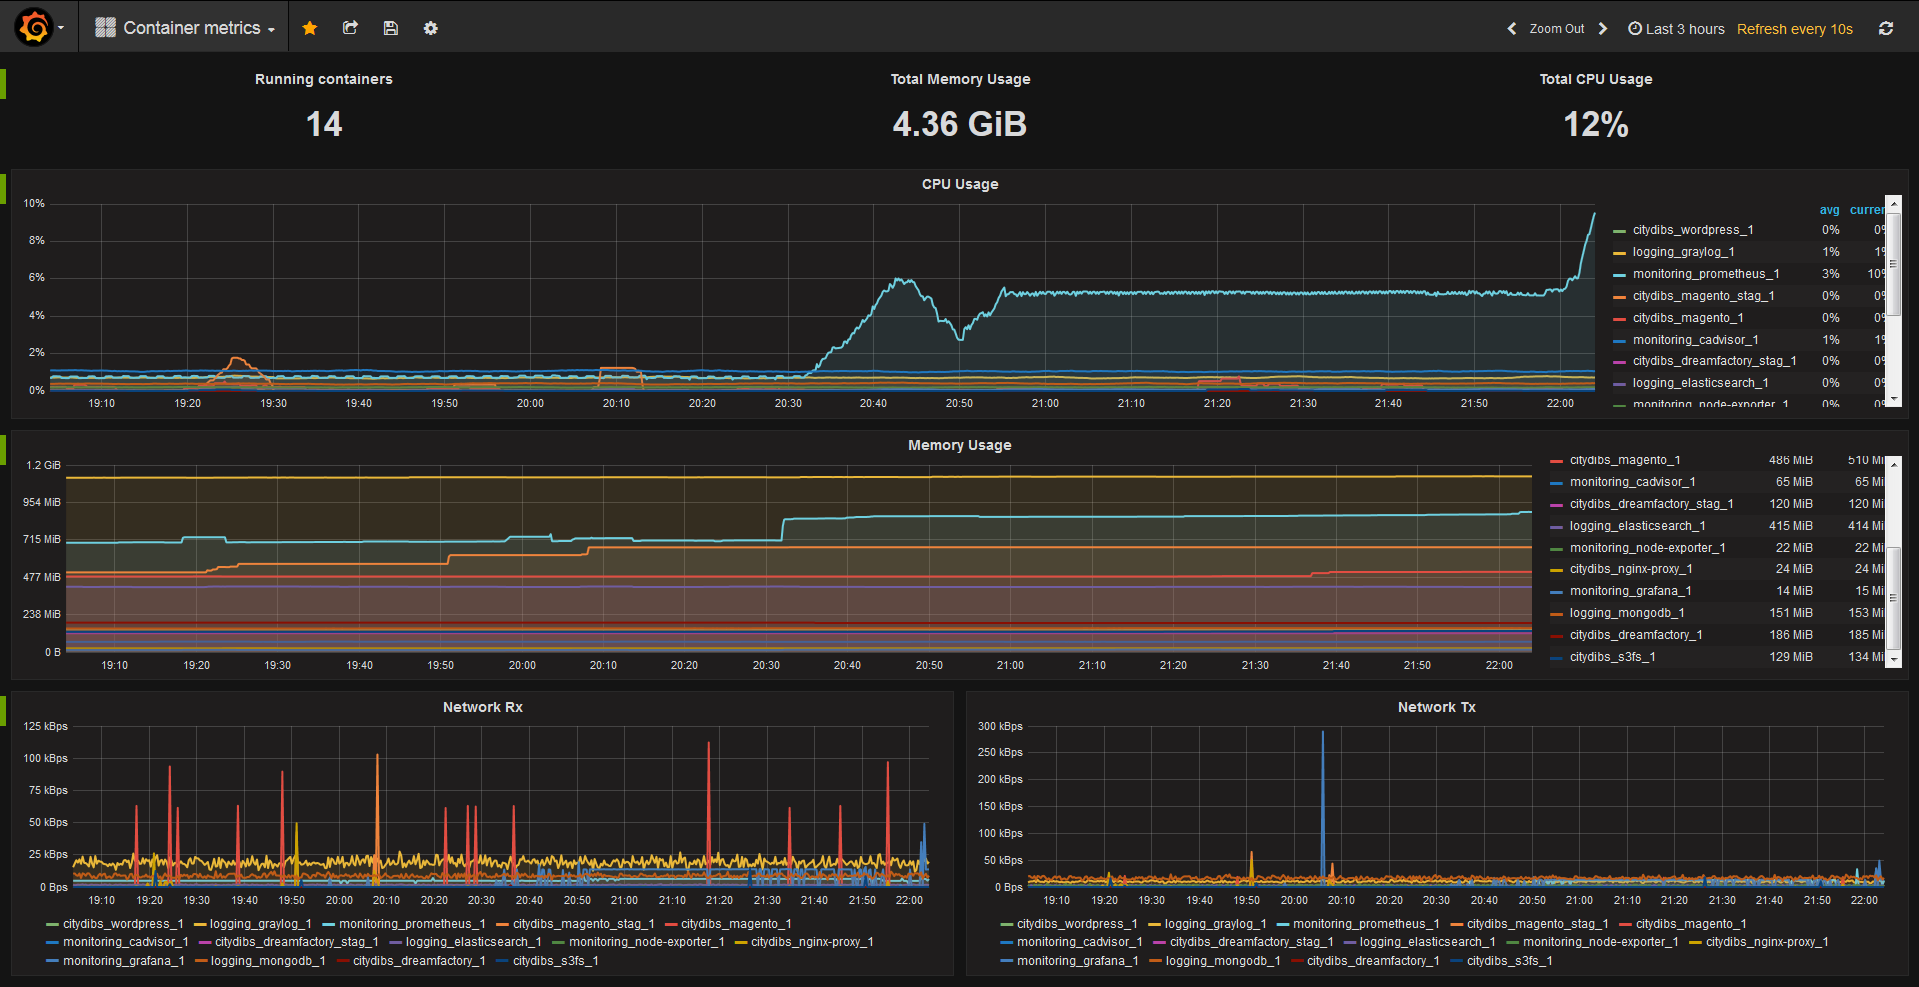
可以去(https://grafana.com/grafana/dashboards/)搜索面板,使用URL导入,或者使用面板id导入,推荐两个id:1860和193,效果图如下: ↗
关于 alertmanager 通知需要设置通知规则,我暂时只配置了一个,用来通知 systemd service失败退出的邮件,配置需要跟 prometheus配置同个目录,/etc/prometheus/alert.rules.yml:
groups:
- name: systemd_unit
  interval: 15s
  rules:
    - alert: systemd_unit_failed
      expr: |
        systemd_unit_state{state="failed"} > 0
      for: 3m
      labels:
        severity: critical
      annotations:
        description: 'Instance : Service failed'
        summary: 'Systemd unit failed'
同时需要修改 /etc/prometheus/prometheus.yml:
rule_files:
  - "alert.rules.yml"
  # - "first_rules.yml"
  # - "second_rules.yml"
如果不想使用包管理器安装软件,可以全部使用 docker,网上找了一个一整套性能,容器监控、日志收集和聚合、可视化展示和消息通知外加容器的自动更新,没有测试,需要的可以按需修改:
version: "3.8"

# 定义数据卷
volumes:
  prometheus_data: {} # Prometheus 数据卷
  grafana_data: {} # Grafana 数据卷
  alertmanager_data: {} # Alertmanager 数据卷
  promtail_data: {} # Promtail 数据卷
  loki_data: {} # Loki 数据卷
  mosquitto_data: {} # Mosquitto 数据卷
  mosquitto_log: {} # Mosquitto 日志卷

# 定义网络
networks:
  monitoring:
    # 监控网络

    # 定义服务
services:
  watchtower:
    image: containrrr/watchtower:latest # 使用watchtower镜像自动更新容器
    environment:
      - WATCHTOWER_LABEL_ENABLE=true
    volumes:
      - /var/run/docker.sock:/var/run/docker.sock # 挂载docker sock
    labels:
      com.centurylinklabs.watchtower.enable: "true" # 允许watchtower更新自身

  node-exporter:
    image: prom/node-exporter:latest # Node Exporter 镜像
    container_name: node-exporter # 容器名
    restart: unless-stopped # 除非停止,否则重启
    volumes:
      # 挂载卷
      - /proc:/host/proc:ro
      - /sys:/host/sys:ro
      - /:/rootfs:ro
    command:
      # 执行命令
      - "--path.procfs=/host/proc"
      - "--path.rootfs=/rootfs"
      - "--path.sysfs=/host/sys"
      - "--collector.filesystem.mount-points-exclude=^/(sys|proc|dev|host|etc)($$|/)"
    ports:
      # 映射端口
      - "9100:9100"
    networks:
      # 使用网络
      - monitoring
    labels:
      # 标签
      com.centurylinklabs.watchtower.enable: "true"

  prometheus:
    image: prom/prometheus:latest # Prometheus 镜像
    container_name: prometheus # 容器名
    restart: unless-stopped # 除非停止,否则重启
    volumes:
      # 挂载卷
      - ./prometheus/prometheus.yml:/etc/prometheus/prometheus.yml
      - prometheus_data:/prometheus
    command:
      # 执行命令
      - "--config.file=/etc/prometheus/prometheus.yml"
      - "--storage.tsdb.path=/prometheus"
      - "--web.console.libraries=/etc/prometheus/console_libraries"
      - "--web.console.templates=/etc/prometheus/consoles"
      - "--web.enable-lifecycle"
      - "--web.enable-admin-api"
    ports:
      # 映射端口
      - "9090:9090"
    networks:
      # 使用网络
      - monitoring
    labels:
      # 标签
      com.centurylinklabs.watchtower.enable: "true"

  cadvisor:
    image: gcr.io/cadvisor/cadvisor-arm64:v0.47.2 # cAdvisor 镜像
    container_name: cadvisor # 容器名
    privileged: true # 需要特权模式
    volumes:
      # 挂载卷
      - /:/rootfs:ro
      - /var/run:/var/run:rw
      - /sys:/sys:ro
      - /var/lib/docker:/var/lib/docker:ro
      - /dev/disk/:/dev/disk:ro
    restart: unless-stopped # 除非停止,否则重启
    devices:
      # 挂载设备
      - /dev/kmsg
    ports:
      # 映射端口
      - "8080:8080"
    networks:
      # 使用网络
      - monitoring
    labels:
      # 标签
      com.centurylinklabs.watchtower.enable: "true"

  mosquitto:
    image: eclipse-mosquitto:latest # Mosquitto MQTT broker 镜像
    container_name: mosquitto # 容器名
    restart: always # 总是重启
    ports:
      # 映射端口
      - "1883:1883"
    networks:
      # 使用网络
      - monitoring
    volumes:
      # 挂载卷
      - ./mosquitto/mosquitto.conf:/mosquitto/config/mosquitto.conf
      - mosquitto_data:/mosquitto/data
      - mosquitto_data:/mosquitto/log
    labels:
      # 标签
      com.centurylinklabs.watchtower.enable: "true"

  loki:
    image: grafana/loki:latest # Loki 日志聚合系统镜像
    container_name: loki # 容器名
    volumes:
      # 挂载卷
      - loki_data:/data
    restart: unless-stopped # 除非停止,否则重启
    ports:
      # 映射端口
      - "3100:3100"
    command:
      # 执行命令
      - "-config.file=/etc/loki/local-config.yaml"
    networks:
      # 使用网络
      - monitoring
    labels:
      # 标签
      com.centurylinklabs.watchtower.enable: "true"

  promtail:
    image: grafana/promtail:latest # Promtail 日志收集器镜像
    container_name: promtail # 容器名
    volumes:
      # 挂载卷
      - /var/log:/var/log
      - promtail_data:/data
    command:
      # 执行命令
      - "-config.file=/etc/promtail/config.yml"
    networks:
      # 使用网络
      - monitoring
    labels:
      # 标签
      com.centurylinklabs.watchtower.enable: "true"

  alertmanager:
    image: prom/alertmanager:latest # Alertmanager 镜像
    container_name: alertmanager # 容器名
    volumes:
      # 挂载卷
      - ./alertmanager/config:/config
      - alertmanager_data:/data
      - alertmanager_data:/alertmanager
    command:
      # 执行命令
      - "--config.file=/config/alertmanager.yml"
    restart: always # 总是重启
    ports:
      # 映射端口
      - "9093:9093"
    networks:
      # 使用网络
      - monitoring
    labels:
      # 标签
      com.centurylinklabs.watchtower.enable: "true"

  grafana:
    image: grafana/grafana:latest # Grafana 可视化平台镜像
    container_name: grafana # 容器名
    volumes:
      # 挂载卷
      - grafana_data:/var/lib/grafana
      - ./grafana/provisioning/dashboards:/etc/grafana/provisioning/dashboards
      - ./grafana/provisioning/datasources:/etc/grafana/provisioning/datasources
      - ./grafana/conf/grafana.ini:/etc/grafana/grafana.ini
    environment:
      # 设置环境变量
      - GF_SECURITY_ADMIN_USER=${GRAFANA_ADMIN_USER} # 管理员用户名
      - GF_SECURITY_ADMIN_PASSWORD=${GRAFANA_ADMIN_PASSWORD} # 管理员密码
      - GF_USERS_ALLOW_SIGN_UP=false # 不允许注册
      - GF_SMTP_ENABLED=true # 启用SMTP
      - GF_SMTP_HOST=${GF_SMTP_HOST} # SMTP主机
      - GF_SMTP_USER=${GF_SMTP_USER} # SMTP用户
      - GF_SMTP_PASSWORD=${GF_SMTP_PASSWORD} # SMTP密码
      - GF_SMTP_FROM_ADDRESS=${GF_SMTP_FROM_ADDRESS} # 发件人地址
    restart: unless-stopped # 除非停止,否则重启
    ports:
      # 映射端口
      - "3000:3000"
    networks:
      # 使用网络
      - monitoring
    labels:
      # 标签
com.centurylinklabs.watchtower.enable: "true"参考: